
Satellites in low Earth orbit live and die by atmospheric drag. Solar Cycle 25 ran far stronger than the pre-cycle consensus forecast, dragging down satellites in LEO faster than anyone expected. Today, we’re putting a number on that loss.
In our new paper for the 40th Annual Small Satellite Conference, we estimate the economic cost of mispredicting Solar Cycle 25: at least $0.88 billion in lost mission life against the forecast’s two-sigma worst case, and $2.77 billion against the nominal forecast.
These are deliberate lower bounds that only include nonpropulsive satellites and direct costs.
Underpredicting the Solar Cycle
For Solar Cycle 25, the consensus prediction was made in 2019 by an international NOAA/NASA/ISES panel, and forecasted a weak cycle in line with the quiet Cycle 24.
The Sun behaved differently. It peaked sooner and stronger than forecast, causing densities in LEO from 2022-2026 to rise to 2-3x the predicted levels. The cumulative dynamic pressure - the driving metric for satellite propellant budgets and mission lifetimes - is currently at 5 standard deviations above the forecast mean. The plots below show what this looks like.
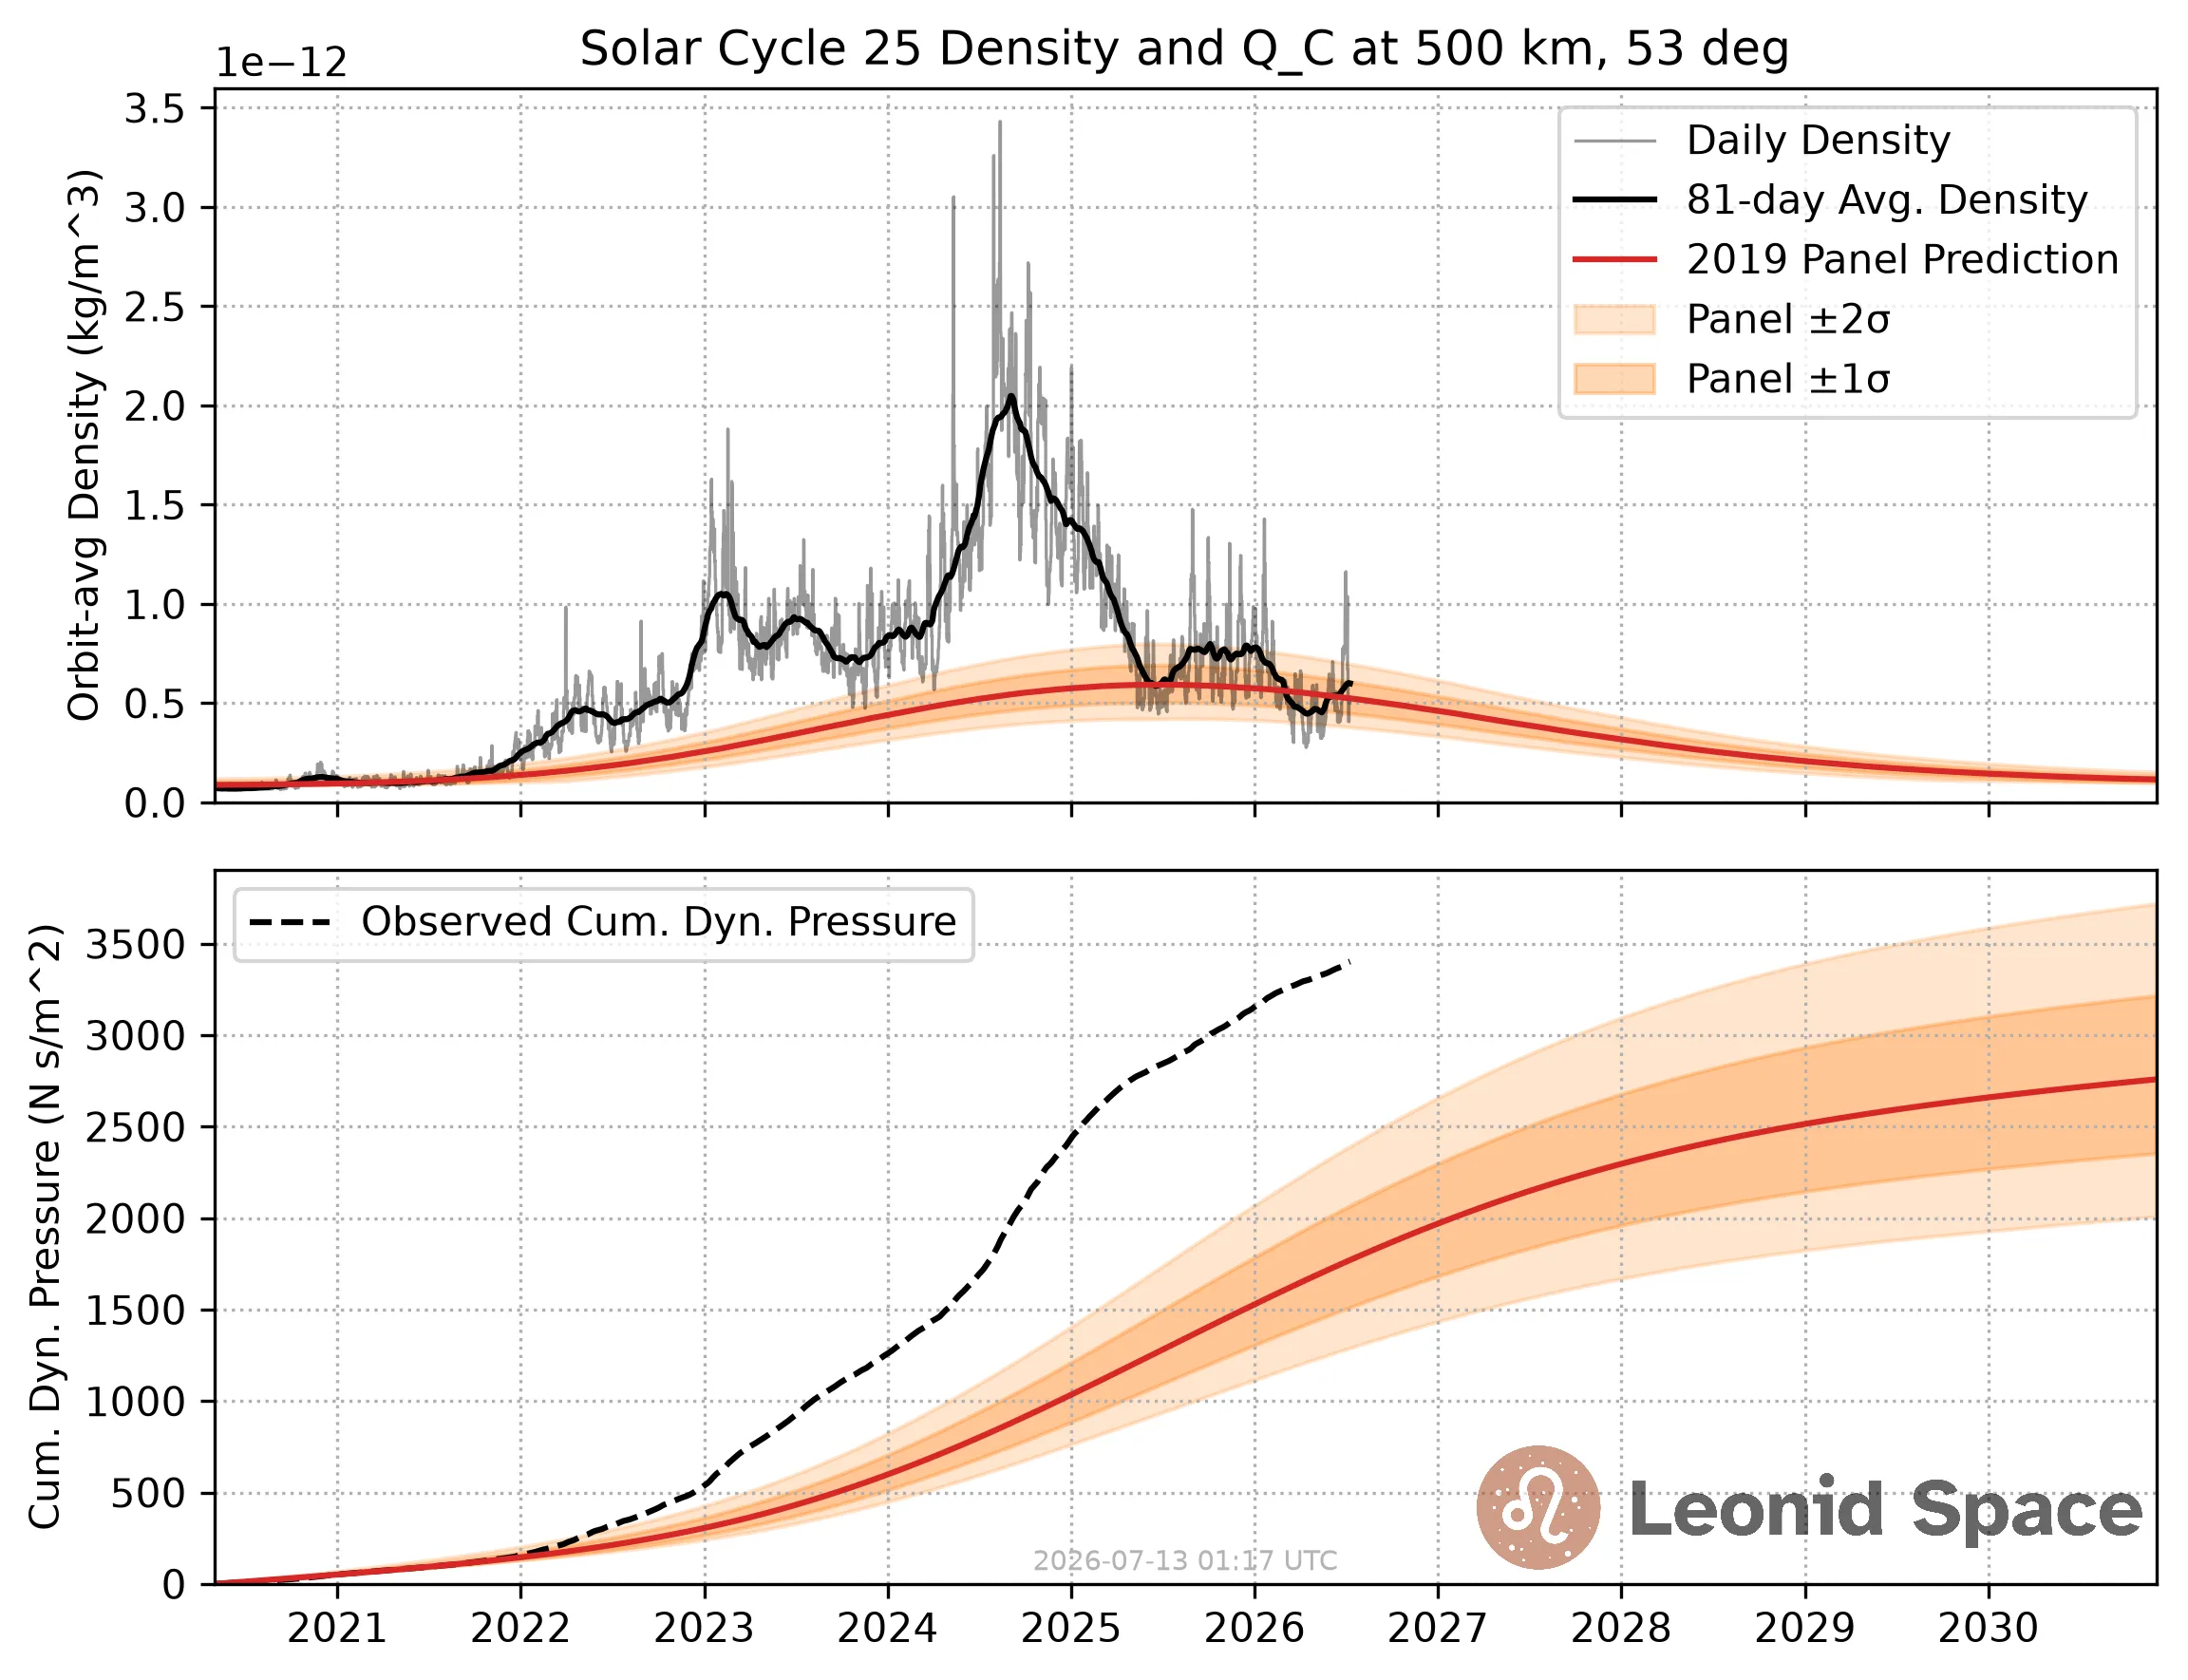
Getting the uncertainty right is even more valuable than the best-guess forecast. Common engineering practice is to design against the two-sigma worst case bounds, covering 95% of plausible scenarios. This cycle invalidated even these conservative design assumptions.
Several satellite operators have come forward with stories of being surprised by drag levels:
- Capella Space reported losing several spacecraft in 2023 due to drag.
- NASA discovered in 2025 that its $500M Swift observatory was due to deorbit in mid-2026, prompting a $30M rescue mission.
- Planet implemented a “low drag” flight mode to stretch the lifespan of its Dove satellites.
But these are just the public announcements, for a whole industry affected by drag.
What Did Drag Cost the Space Industry?
We wanted to know how much value was lost across all of LEO, from the real drag levels versus the worst case design environment.
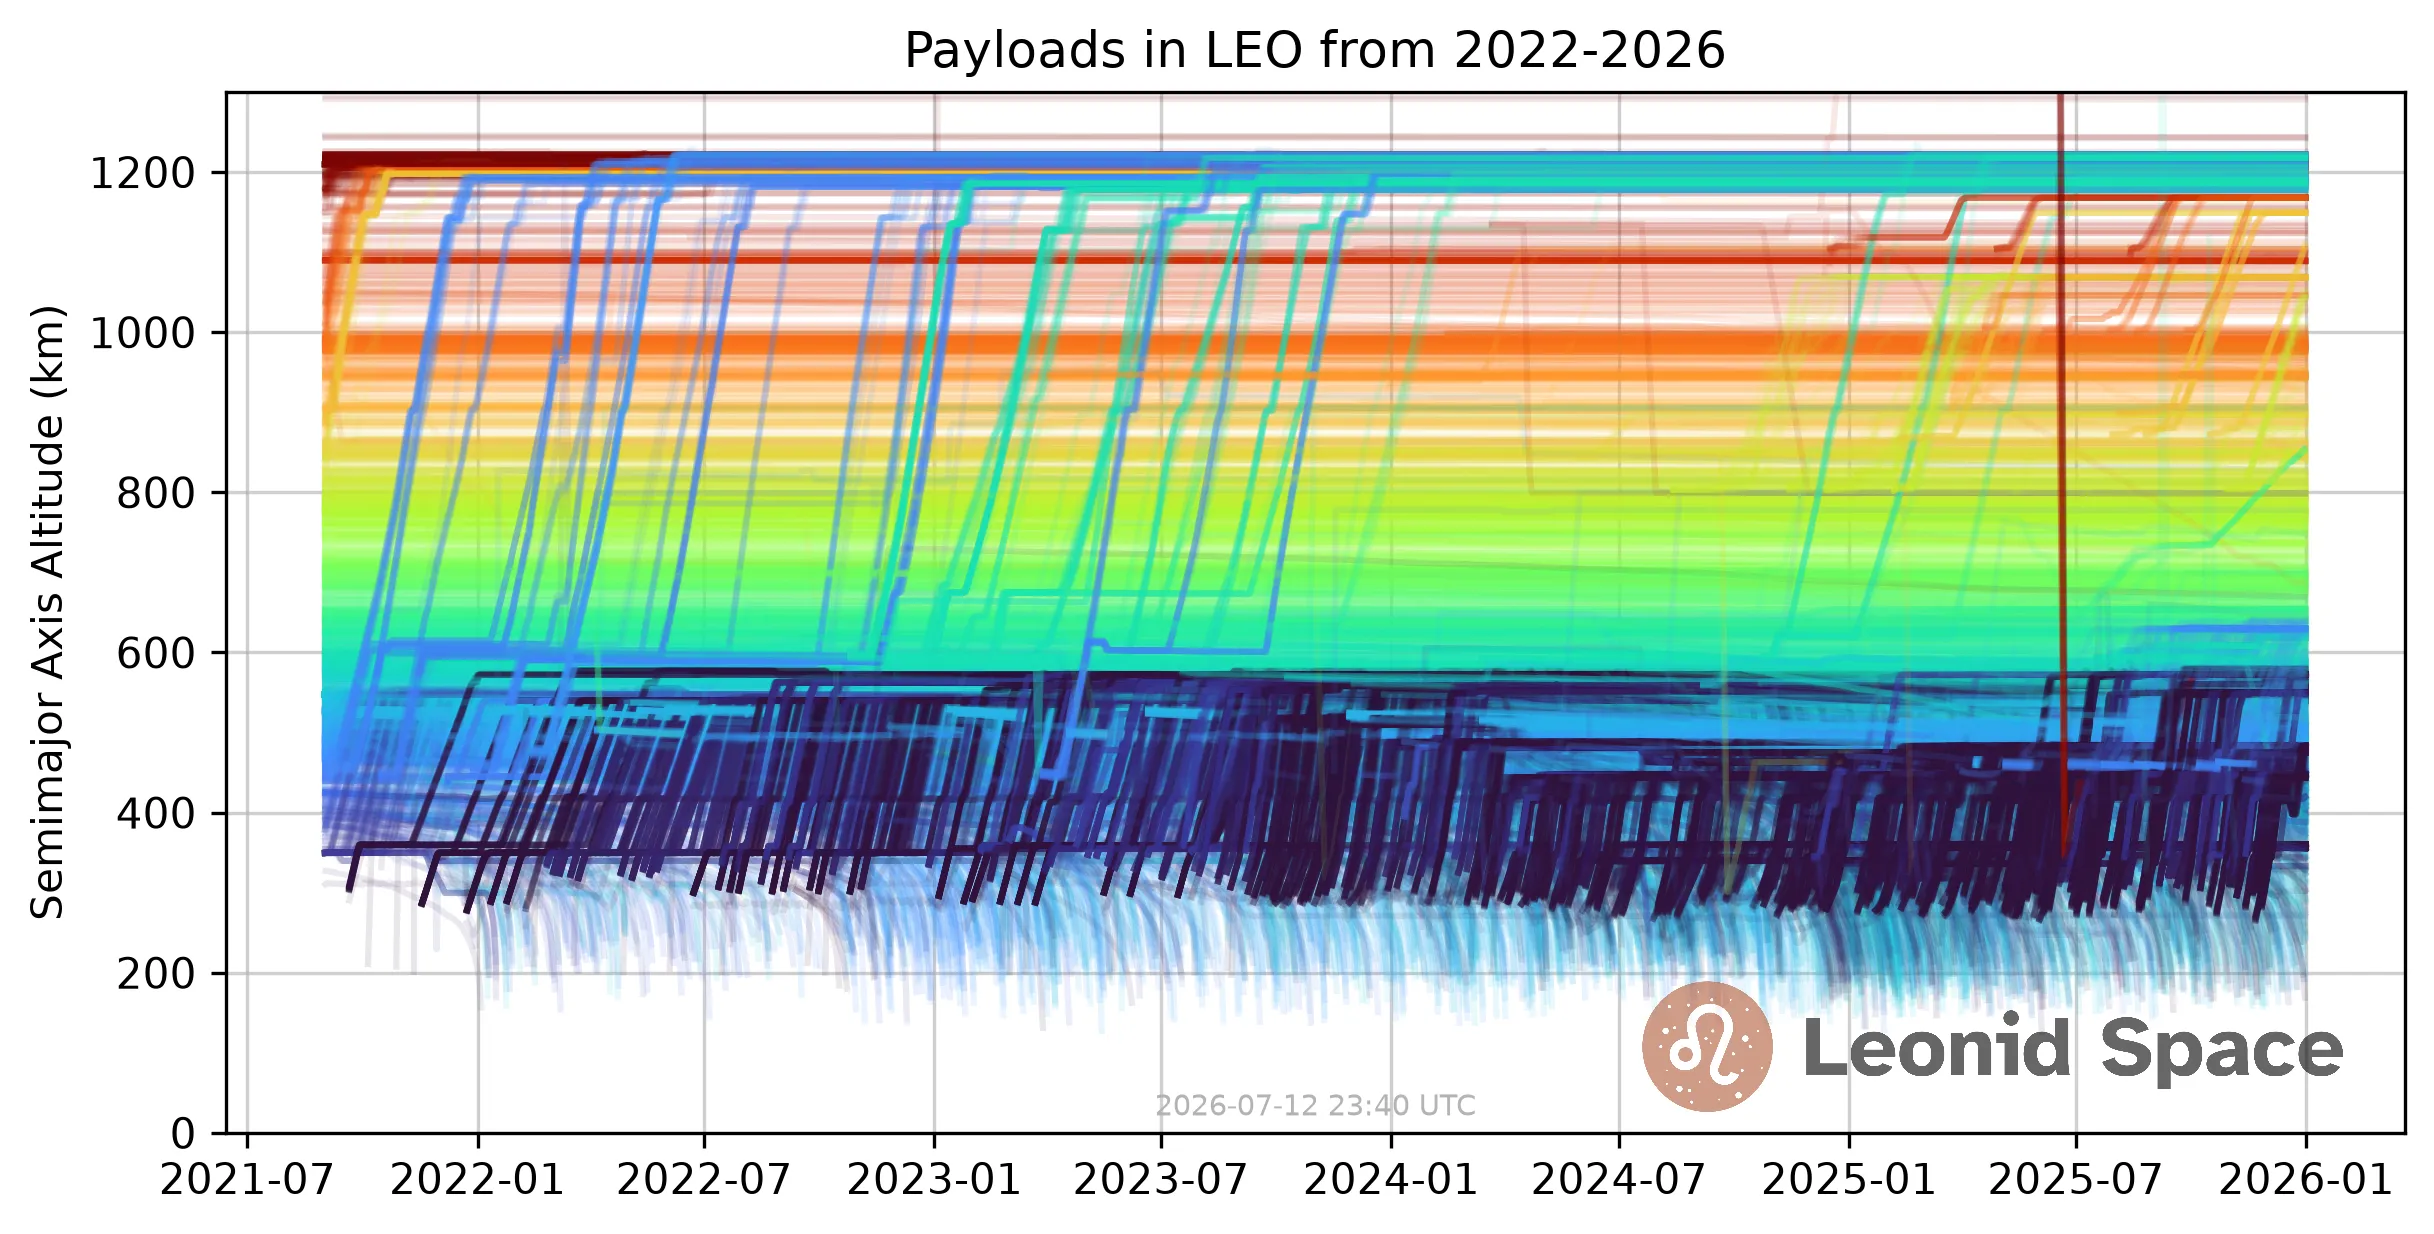
Starting from the 13,704 payloads on-orbit below 800 km during 2022-2026, we screened down to 1,597 satellites validated with high confidence to be both operational and in ballistic freefall. For each one, we used our validated drag-analysis pipeline to estimate its ballistic coefficient from tracking data, propagate its trajectory under the forecasted atmosphere versus the observed one (and the full range of Solar Cycle 26 futures), and price the difference in lifetime with a probabilistic cost model run through a Monte Carlo simulation.
The result: against the two-sigma design case, these satellites lost 688 mission-years worth a net $0.88 billion. Against the nominal forecast, 2,472 mission-years worth $2.77 billion. The $0.88B is net of roughly $1.30B in lifetime losses, and $0.41B in lifetime gains from recently launched satellites benefiting from the solar cycle decaying sooner than predicted. Over two-thirds of the affected satellites have already deorbited, with $0.76 billion of losses already realized.
Why This Is a Lower Bound
Our reference set of non-propulsive satellites represents just 4.8% of all satellite value in LEO. The analysis excludes:
- Propulsive satellites - including the Starlink, OneWeb, and Leo (Kuiper) megaconstellations. Drag still ate away at these satellites’ fuel reserves, but we can’t estimate impact without knowing how much fuel they started with.
- Revenue above direct cost - we count only capital costs and direct operational expenses, and not profit or other business expenses which must be supported by operations.
- Downstream economic impact - the value that data and services from satellites create for their end users.
Because of these, we believe the true cost is much higher.
An Underappreciated Risk
For context, our lower-bound estimate is comparable in magnitude to another paper’s $0.7 billion loss from a hypothetical one-in-100-year SEP radiation event. It also rivals a decade of expected losses from orbital debris collisions. Not only are losses here of comparable magnitude, but they’ve already happened. Sustained drag belongs alongside space weather risks that receive considerably more attention.
The satellites being designed and built today will fly through Solar Cycle 26, and it’s crucial that operators model the full range of potential space environments to ensure the success of their mission. We can help with that.
Two Lessons
Calibrated uncertainty bounds are as valuable as the forecast itself. The $0.88 billion is the cost of the worst case scenario not bounding reality. Future predictions should treat uncertainty quantification as a first-class product.
Continuous monitoring protects your mission. The imminent reentry of NASA’s Swift observatory wasn’t discovered until 2025, leaving the rescue mission racing the clock with only weeks of margin remaining. Continuous lifetime monitoring could have caught this years earlier - time to change flight modes, replan and replenish, or mount a rescue with much more time to spare.
These two lessons are why Leonid Space exists. Our probabilistic lifetime predictions are validated against six decades of flight data, and our real-time Lifetime Monitoring service alerts you the moment space weather shifts the timeline.
Read the Paper
The full paper, including the methodology, cost model, results, and case studies examining Swift and Hubble, is available on arXiv.
Contact us to protect your assets with predictions you can trust. And find us at SmallSat in Salt Lake City next month where we’ll be presenting these results.
When will your satellite deorbit?